


Nel cuore del parco
Una struttura a basso impatto ambientale ecocertificata, pronta ad ospitarti.
Camera Singola 45 euro
Camera Matrimoniale 80 euro
Camera Tripla 100 euro
Camera Quadrupla 120 euro
Prima colazione compresa.
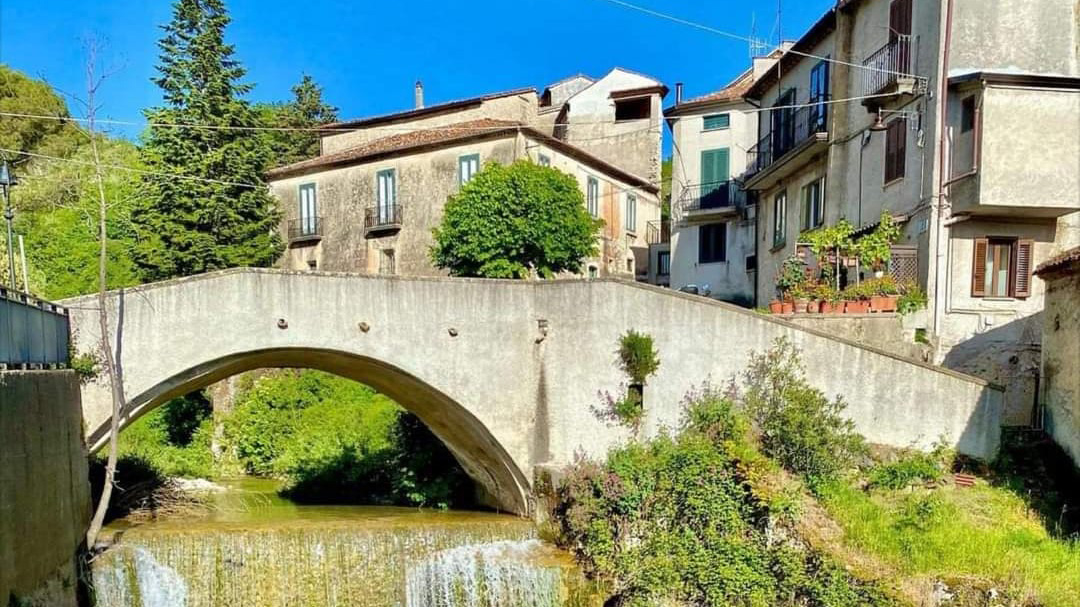
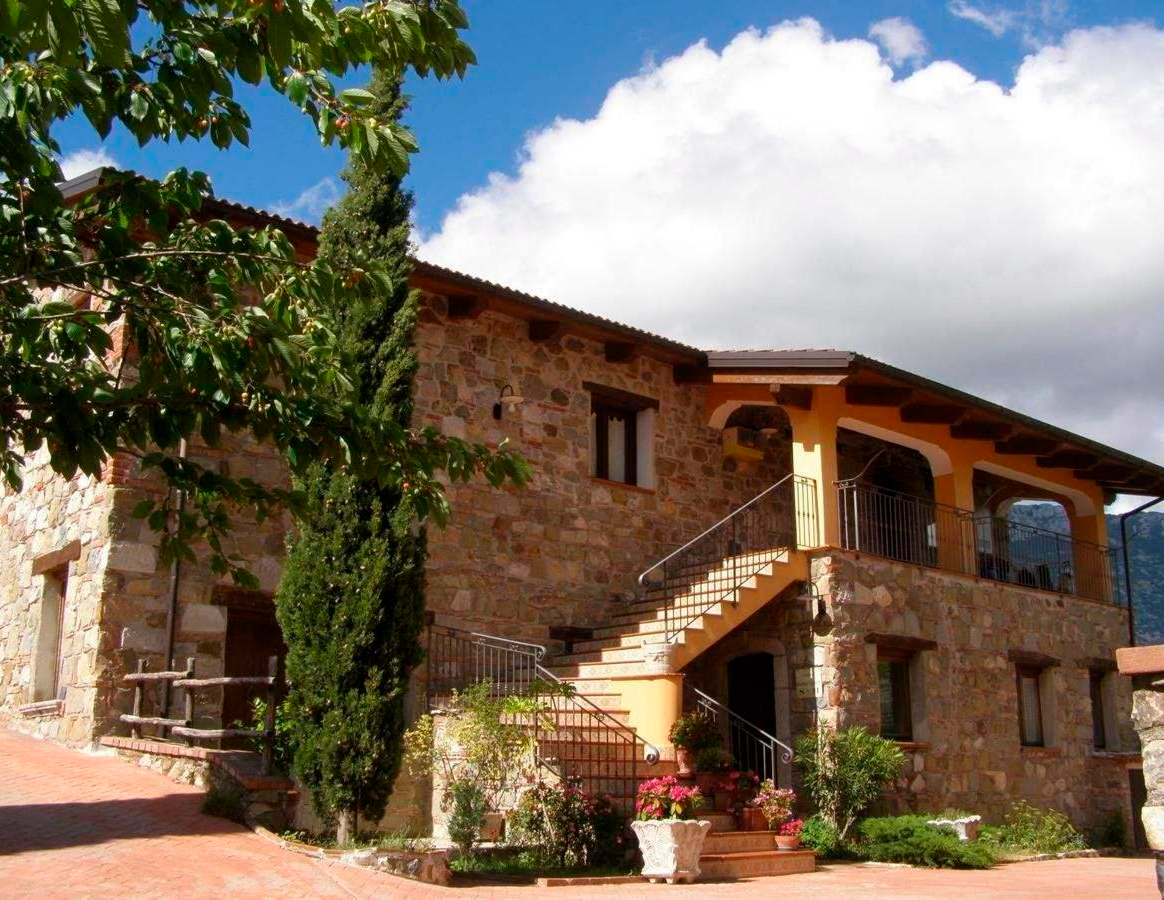
Turismo rurale
In due casali finemente ristrutturati, ubicata a Piaggine , in zona 1 (massima tutela) del Parco Nazionale del Cilento, il B&B Le Grazie è un’azienda turistico ricettiva a basso impatto ambientale ecocertificata.
Prenota ora via email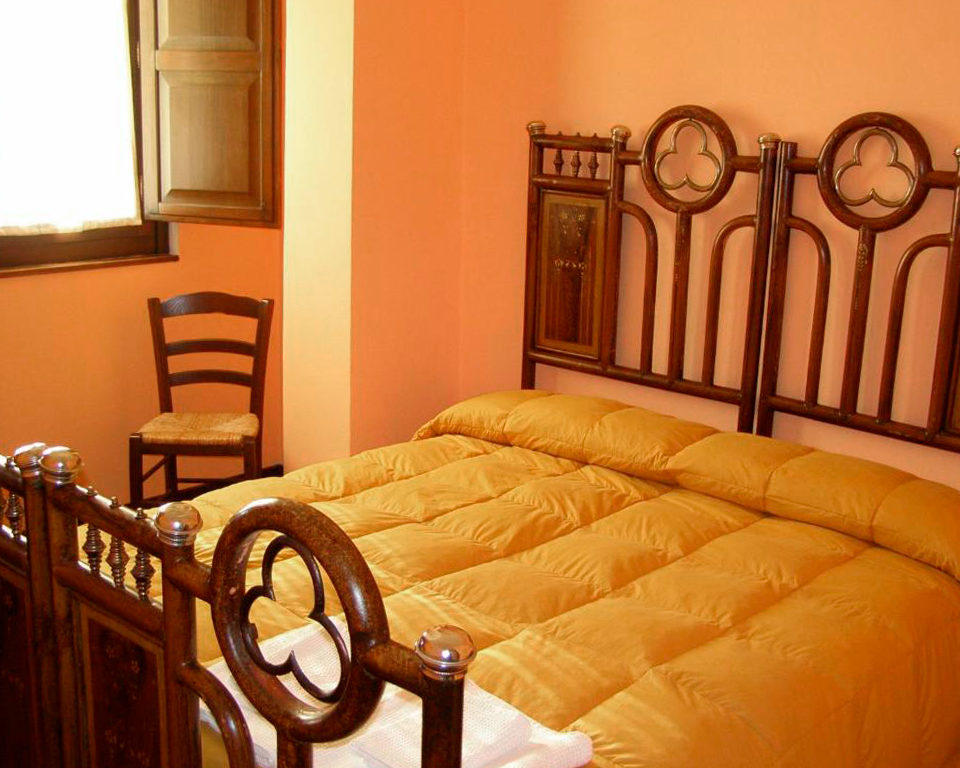
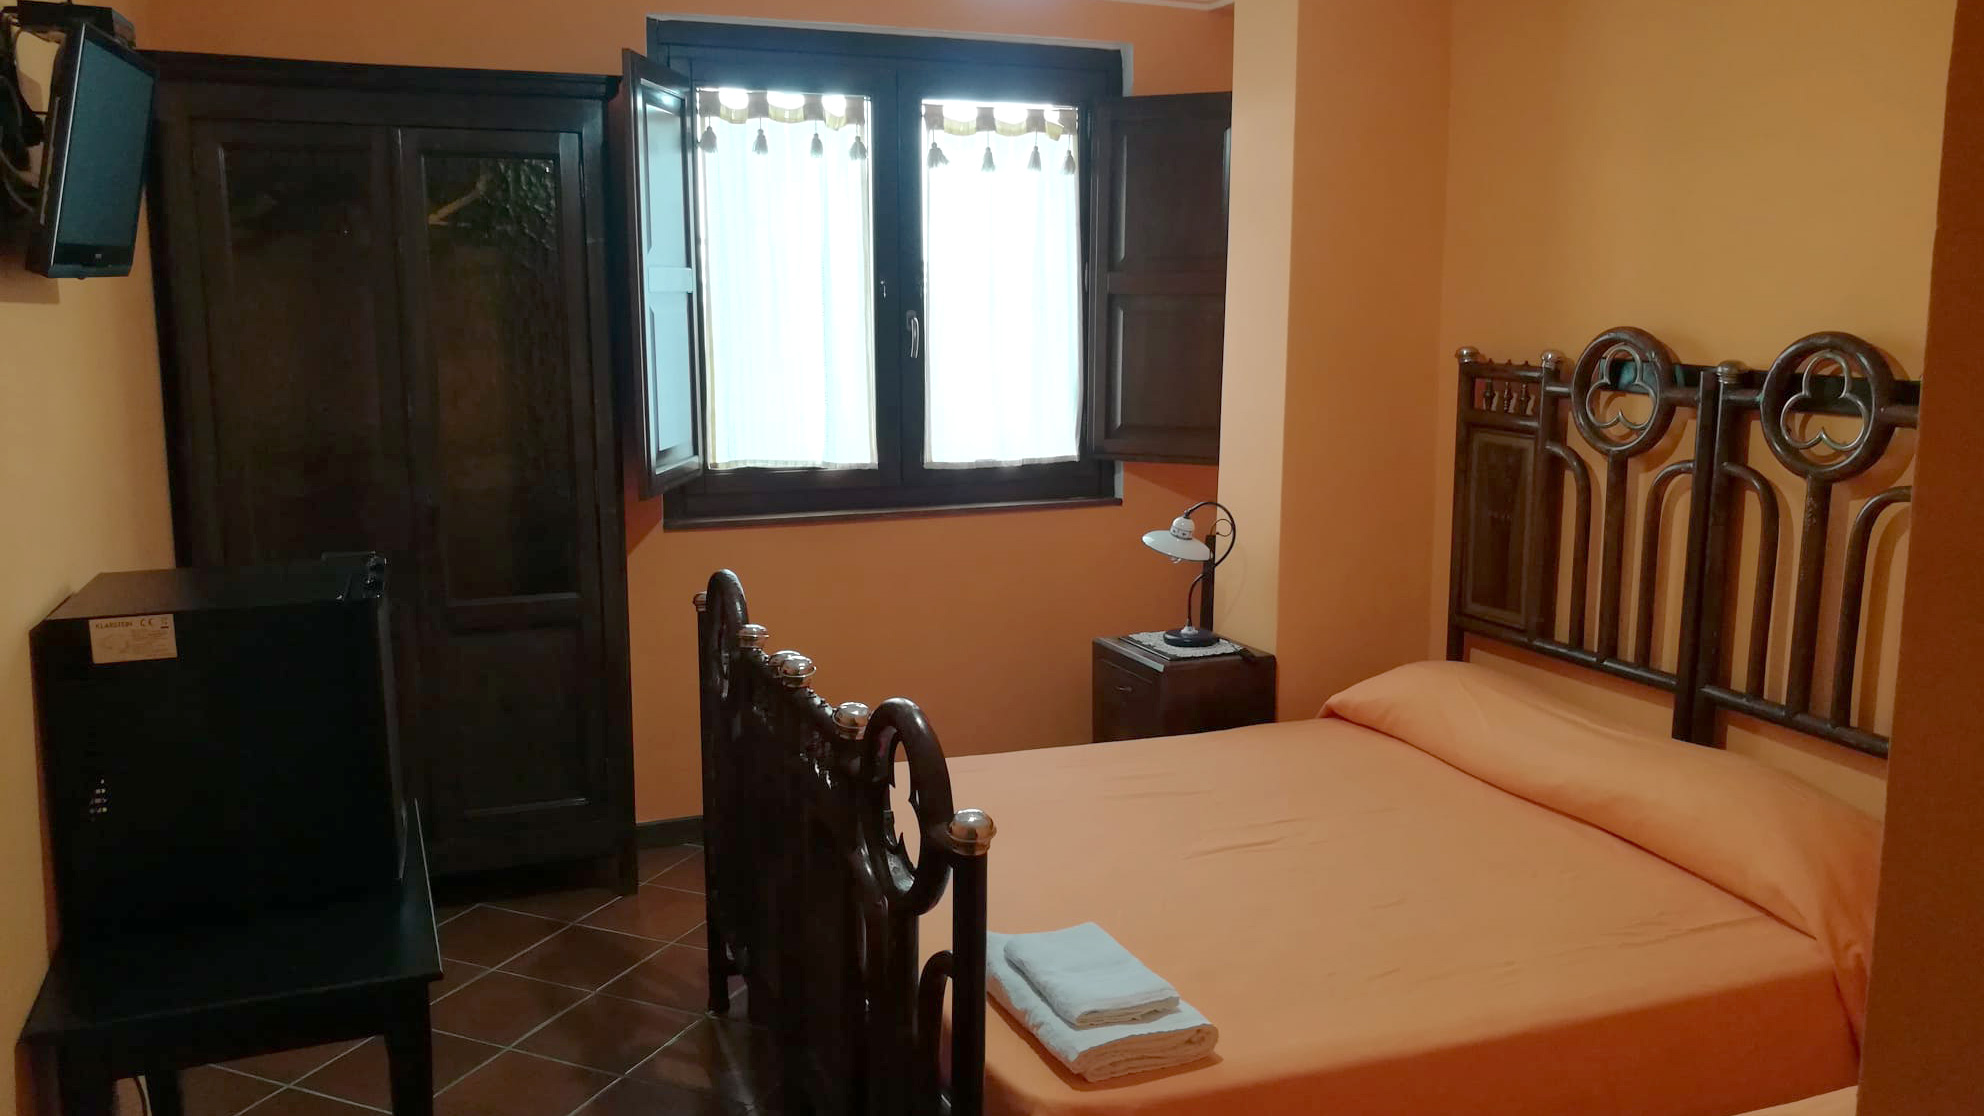
Dotazioni
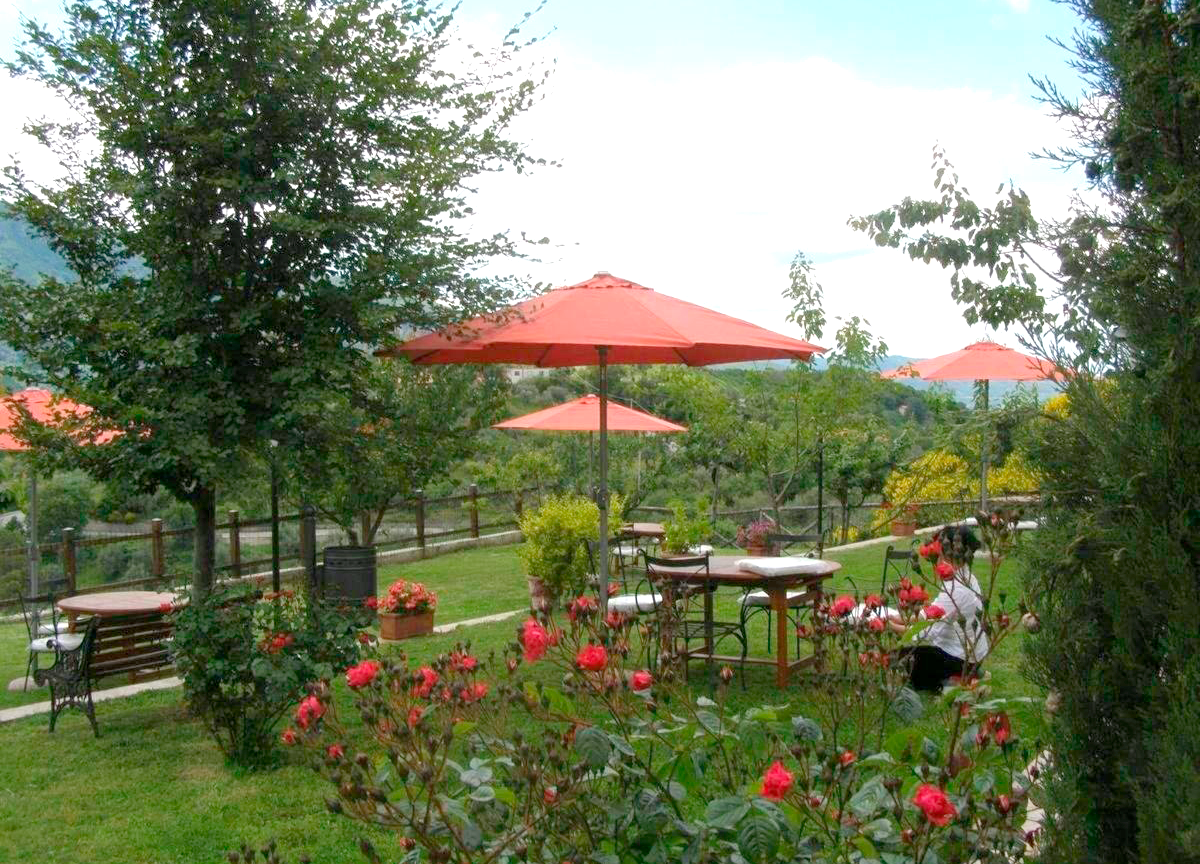
C’è un bagno privato con set di cortesia ecologico e Tv satellitare e terrestre in ogni unità. Disponibile il parcheggio privato gratuito e l’uso del giardino con la zona barbecue. Sono ammessi animali. Il WiFi è gratis in tutta la struttura.
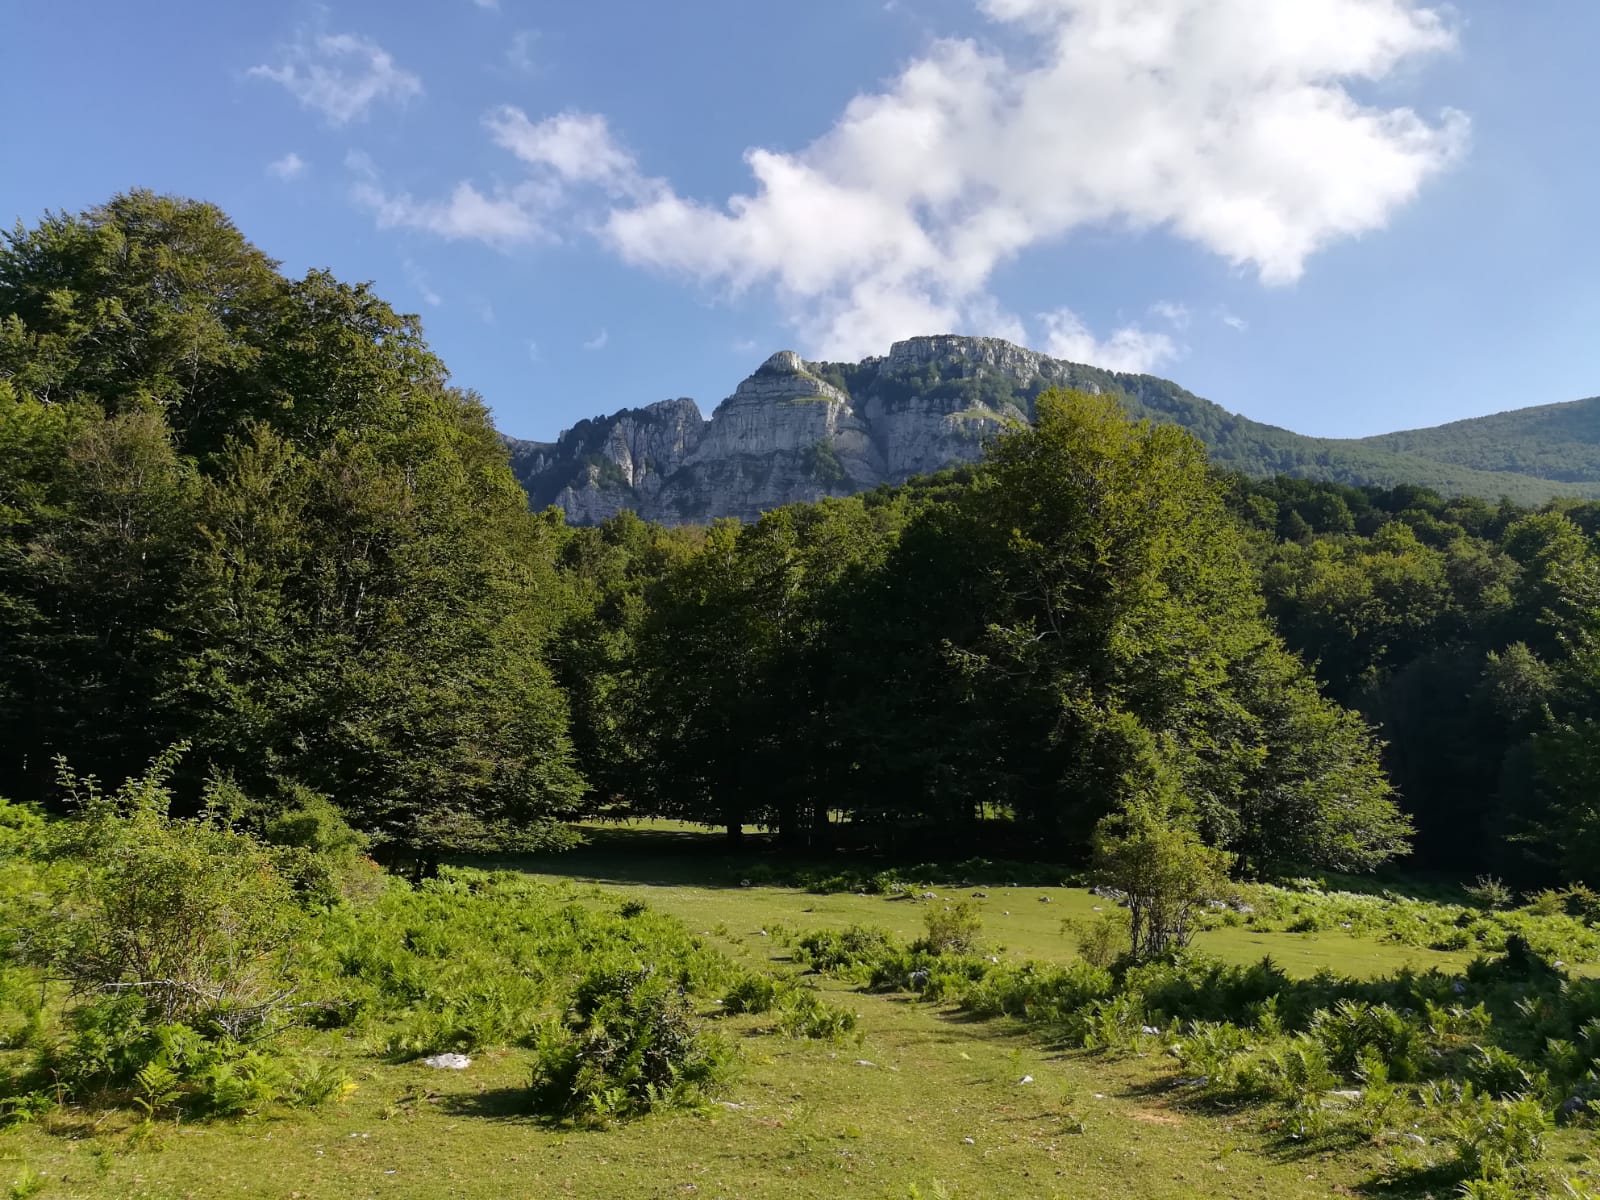
DotazioniIl parco
È possibile impegnarsi in varie attività, come lo sci e le escursioni. Luoghi da visitare : Monte Cervati, Le Gole del Calore, Roscigno Vecchia, Sorgenti del Sammaro, Certosa di Padula, Paestum, Velia ecc.
PosizioneContatti
B&B Le Grazie
Via Madonna delle Grazie 65
84065 Piaggine
Italia